Key Takeaways
- In 2026, supply chain KPIs must measure resilience, cost control, and cash efficiency—not just volume or speed.
- Rising tariffs, labor constraints, and freight volatility are making cost-focused KPIs essential for U.S. supply chains.
- The most valuable KPIs connect operational execution directly to financial outcomes.
- Inventory flow, transportation accuracy, and order reliability now drive competitive performance.
- Standardized platforms—like pooled plastic pallets—remove hidden variability that distorts KPI results.
As supply chains move into 2026, performance measurement is no longer just about efficiency. It is about resilience, predictability, and cost control in an increasingly complex operating environment. Rising transportation costs, labor constraints, automation adoption, and tighter customer expectations are forcing supply chain leaders to rethink which metrics truly reflect performance.
Recent analysis shows that new tariffs could raise material and service costs across U.S. supply chains by 4% to 40% in 2026. At the same time, labor disruptions and geopolitical instability in 2025 forced many U.S. companies to reconfigure sourcing, inventory strategies, and fulfillment networks—exposing gaps in visibility, responsiveness, and cost control across the supply chain.
In this environment, the right supply chain KPIs help organizations identify bottlenecks, uncover hidden costs, protect service levels, and make smarter decisions across procurement, warehousing, transportation, and fulfillment. More importantly, they shift organizations from reactive problem-solving to proactive optimization.
What Are Supply Chain KPIs?
Supply chain KPIs (Key Performance Indicators) are measurable values used to evaluate how effectively a supply chain performs across planning, sourcing, production, storage, transportation, and delivery.
Unlike high-level financial metrics, supply chain KPIs focus on execution. They measure how reliably goods move, how quickly cash flows, where cost leaks occur, and how operational risk shows up in daily performance. Strong KPI frameworks connect these operational signals to business outcomes such as cost reduction, customer satisfaction, and working capital optimization.
Supply Chain KPI Examples
Most supply chain KPIs fall into five core categories:
- Service-level metrics such as perfect order and fill rate
- Financial metrics such as cash-to-cash cycle time, GMROI, and DSO
- Inventory metrics including days of supply, turnover, and velocity
- Transportation metrics like freight bill accuracy and utilization
- Operational efficiency metrics such as cycle time and exception rates
High-performing organizations balance KPIs across these categories rather than optimizing one at the expense of another.
Top Supply Chain Metrics and KPIs to Track in 2026
As U.S. supply chains move into 2026, the conversation around KPIs and metrics has shifted. Measuring volume alone no longer reflects the health of a company’s supply chain. Supply chain leaders are prioritizing KPIs that connect operational execution to financial performance. These metrics reveal where cost, risk, and delay accumulate across the end-to-end supply chain—from order receipt to cash collection.
Perfect Order
Perfect Order measures the percentage of orders delivered on time, complete, damage-free, and with accurate documentation. Because it spans warehousing, transportation, and handling, it is one of the clearest indicators of end-to-end execution quality.
Declines in perfect order performance often expose upstream issues such as inconsistent pallet quality, congestion at docks, or unreliable handoffs that directly impact revenue and customer confidence.
Cash-to-Cash Cycle Time
Cash-to-cash cycle time measures how long capital is tied up between paying suppliers and collecting from customers. As interest rates remain elevated, long cycle times increase financial exposure.
This KPI highlights excess inventory, slow throughput, and inefficient handling that inflate total supply chain cost.
Customer Order Cycle Time
Customer order cycle time tracks the elapsed time from order placement to delivery. In 2026, consistency matters as much as speed.
Variability in this metric often signals congestion, manual intervention, or uneven material flow—all of which increase expediting costs and strain logistics networks.
Fill Rate
Fill rate measures how effectively demand is met from available inventory without backorders or substitutions. Poor fill rates point to forecasting gaps, stock imbalances, or slow replenishment cycles.
Improving fill rate protects revenue, stabilizes service levels, and reduces costly recovery actions.
Inventory Days of Supply
Inventory days of supply shows how long current inventory will last based on demand. Too many days increase carrying cost and tie up capital. Too few increase stockout risk.
Leading organizations use faster throughput and better visibility to maintain tighter, more responsive inventory positions.
Inventory Turnover
Inventory turnover measures how often inventory is sold and replaced. Low turnover often indicates excess stock, slow-moving SKUs, or inefficient storage.
Stronger turnover improves cash flow and reduces risk across the supply chain.
Inventory Velocity
Inventory velocity measures how quickly inventory moves through warehouses, yards, and staging areas. It is one of the most actionable KPIs for identifying congestion and bottlenecks.
Slow velocity increases labor strain, handling cost, and cycle time—making it a priority metric for 2026.
Freight Bill Accuracy
Freight Bill Accuracy measures how closely invoiced charges match contracted rates and actual service. It is a key transportation and cost-control metric.
Small discrepancies—from detention, accessorials, or incorrect weights—can quietly inflate supply chain cost. Auditing this KPI helps organizations protect margins and improve cost visibility across supply chain logistics.
Freight volatility continues to amplify the impact of billing errors. In 2025, Freightos reported double-digit freight cost increases on several global lanes, including air freight routes to North America, underscoring how small discrepancies in weights, accessorials, or detention can quickly compound into significant logistics spend.
Days Sales Outstanding (DSO)
Days Sales Outstanding tracks how long it takes to collect payment after a sale. While often viewed as a finance metric, DSO is closely tied to supply chain execution.
Shipment errors, delivery disputes, and incomplete documentation delay invoicing and payment. Improving upstream accuracy helps reduce DSO and strengthen cash flow across the company’s supply chain.
Gross Margin Return on Investment (GMROI)
GMROI measures how much gross margin is generated for every dollar invested in inventory. It is one of the most important profitability metrics for assessing whether inventory strategies are truly creating value.
Damage, rework, inefficient handling, and inconsistent platforms can erode GMROI even when sales volumes remain strong—making it a critical KPI for supply chain strategy in 2026.
Why These Supply Chain KPIs Matter Together
Individually, each KPI highlights a specific issue. Together, they provide a complete view of total supply chain performance, showing how execution affects cash flow, how inventory flow affects cost, and how operational discipline drives profitability.
For supply chain managers, these KPIs form the foundation of modern supply chain management. When supported by accurate data and aligned ownership, they enable faster decisions, stronger control, and sustained improvement.
How to Improve Supply Chain KPIs
Improving KPIs requires addressing root causes rather than chasing individual metrics. High-performing organizations focus on:
- Reducing variability in handling, packaging, and platforms
- Improving data accuracy and real-time visibility
- Standardizing processes across facilities and partners
- Eliminating rework, damage, and manual exceptions
- Aligning KPIs across teams to avoid siloed optimization
Consistent execution enables consistent measurement—and improvement.
The Role of Plastic Pallet Pooling in Supply Chain Metrics Improvement
While pallets are often overlooked in KPI discussions, they directly influence many core supply chain metrics.
Standardized plastic pallets support KPI improvement by:
- Reducing product damage, improving perfect order and GMROI
- Improving inventory velocity through consistent handling and stacking
- Shortening cycle times by reducing jams, rework, and dock delays
- Improving freight accuracy with consistent dimensions and weights
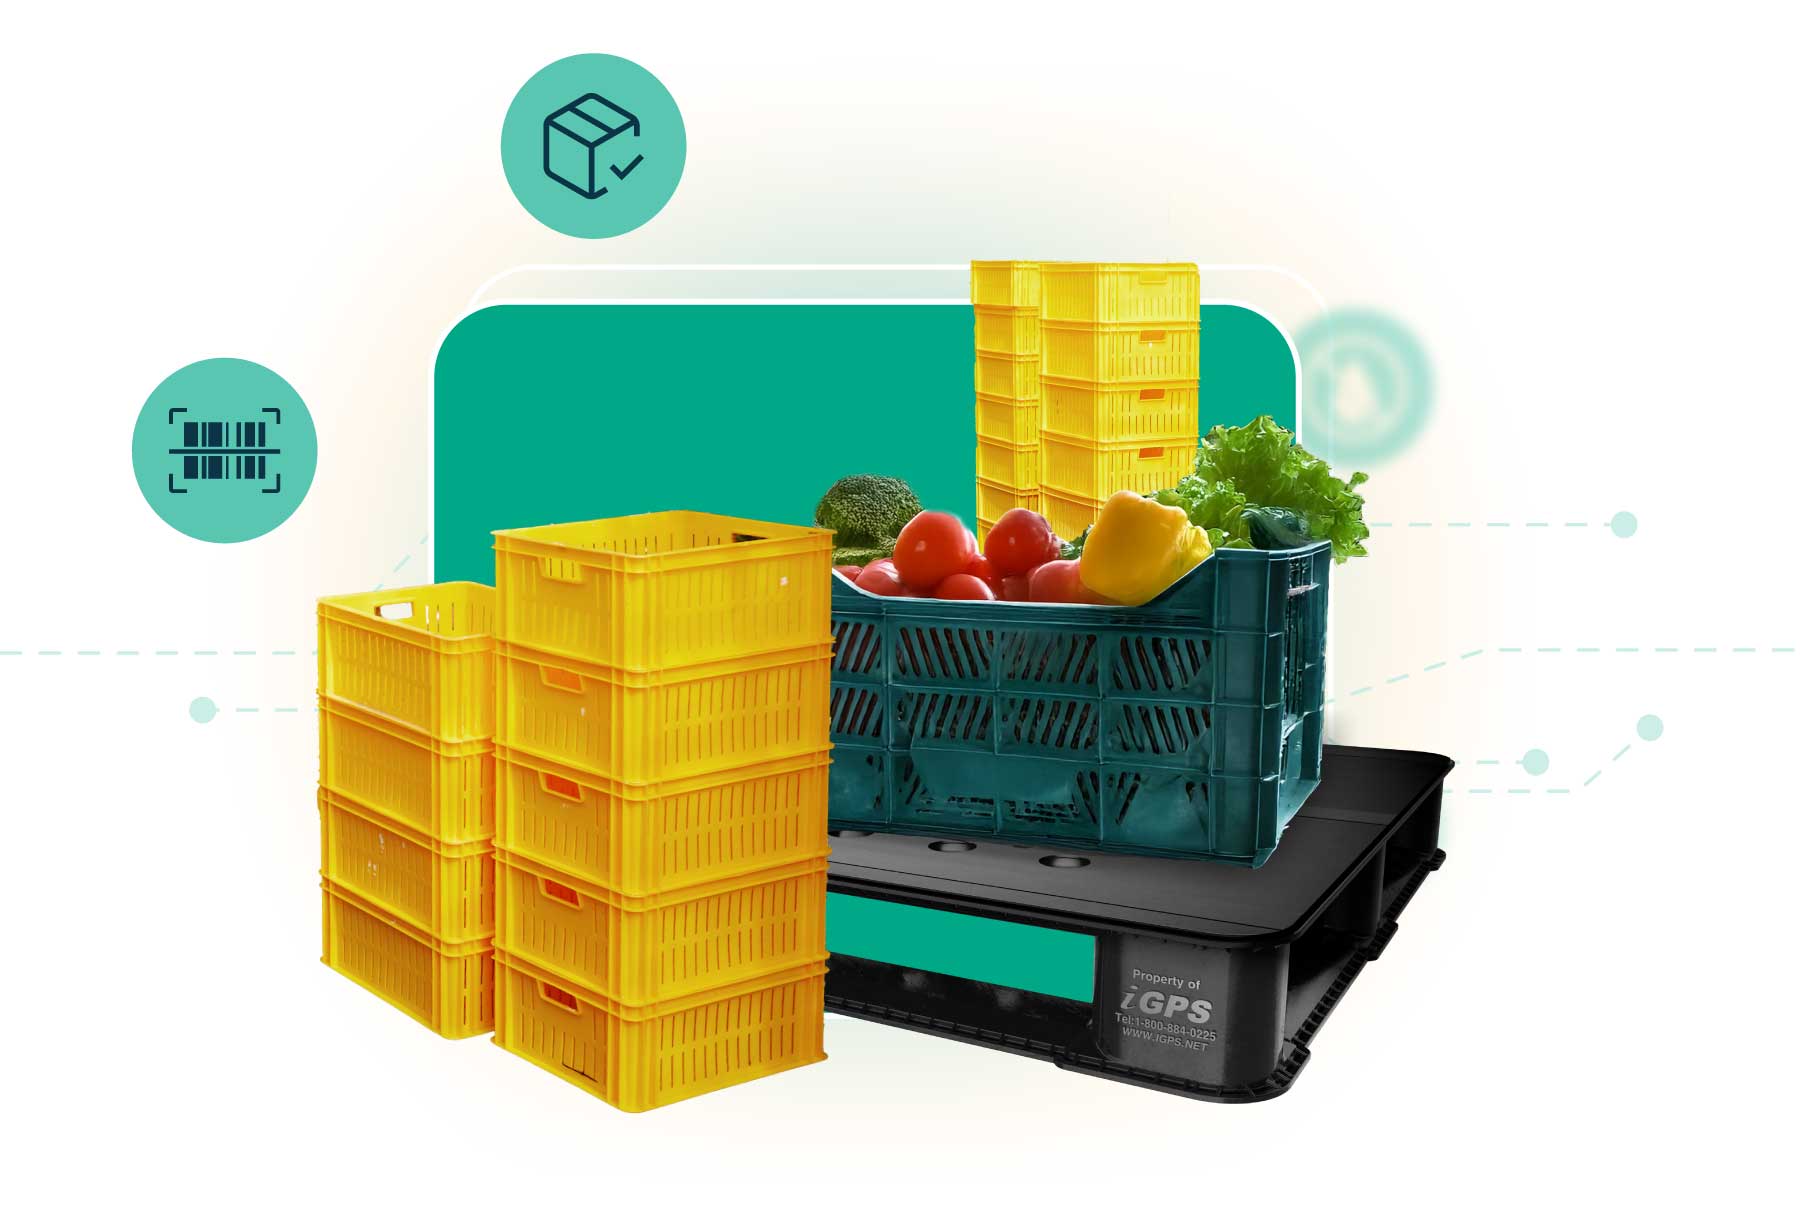
- Supporting visibility through RFID-enabled pallet tracking
Pallet pooling removes variability caused by mixed pallet types, broken boards, excess empties, and inconsistent quality. By treating pallets as a managed service rather than an owned asset, companies eliminate hidden inefficiencies that distort KPI performance.
Conclusion
In 2026, supply chain performance is defined by how well organizations control cost, protect cash flow, and respond to disruption. The most effective ways to improve supply chain KPIs focus on eliminating variability, increasing visibility, and strengthening execution across every function.
For supply chain managers, tracking the right KPIs, and supporting them with standardized, reliable platforms, creates measurable cost savings and a durable competitive advantage. When execution improves, the metrics follow.
FAQ
How do supply chain KPIs differ from inventory management KPIs?
Supply chain KPIs measure performance across the entire flow of goods—from suppliers to customers—while inventory management KPIs focus specifically on stock levels, turns, and availability. Inventory KPIs are a subset of broader supply chain metrics.
How to choose the right KPIs for your organization
The best KPIs align with your business model, volume, and risk profile. Start by identifying where costs, delays, or service failures occur most often. Choose metrics that reveal root causes, not just outcomes, and ensure teams can act on the data. Fewer, well-chosen KPIs are more effective than tracking dozens without clear ownership.
Which supply chain KPIs matter most in 2026?
In 2026, the most important supply chain KPIs are those that measure speed, cost, accuracy, and resilience. These include Perfect Order Rate, Inventory Turnover, Cash-to-Cash Cycle Time, Customer Order Cycle Time, and Freight Bill Accuracy.
Together, these metrics show how well a supply chain delivers on time, controls cost, and adapts to disruption. Supply chain managers are focusing less on isolated metrics and more on KPIs that reflect end-to-end performance.
What KPIs help reduce supply chain costs?
KPIs that directly reduce cost focus on labor efficiency, transportation spend, inventory carrying cost, and avoidable errors. High-impact examples include Inventory Days of Supply, Inventory Turnover, Freight Cost per Unit, Transportation Utilization, and Perfect Order Rate.
Improving these KPIs lowers overtime, reduces excess inventory, cuts rework, and improves trailer utilization. Cost savings usually come from fixing inefficiencies, not cutting service levels.
How does pallet quality affect supply chain KPIs?
Pallet quality directly impacts many operational KPIs. Inconsistent or damaged pallets increase product damage, slow warehouse flow, and create safety risks that reduce productivity.
High-quality, standardized pallets improve metrics such as Perfect Order Rate, Order Cycle Time, Dock Throughput, and Damage Rates. When pallets move smoothly through forklifts, conveyors, and storage systems, KPIs improve without changing labor or layout.
How does pallet pooling improve supply chain performance metrics?
Pallet pooling improves supply chain KPIs by removing variability and waste from pallet handling. Pooled pallets arrive in consistent condition, are recovered after use, and are managed by a third-party provider.
This improves metrics such as Order Cycle Time, Inventory Velocity, Transportation Utilization, and Labor Efficiency. Pallet pooling also reduces hidden costs tied to pallet repairs, empty pallet storage, and retrieval trips, helping supply chains perform more predictably at scale.
Supply chain KPIs only deliver value when the underlying operations are consistent and predictable. iGPS plastic pallet pooling helps supply chain managers improve core performance metrics by removing pallet variability, reducing damage, and improving flow.
By combining standardized, RFID-enabled plastic pallets with a managed pooling network, iGPS helps organizations lower total supply chain cost and build a more resilient, competitive supply chain. To learn how iGPS supports KPI improvement and long-term cost control, call 1-866-983-3874, email switch@igps.net, or visit the contact page.